


Roman Kamushken
As the digital landscape becomes more data-driven, dashboard templates become more important to businesses as necessary tools for decision-making and performance monitoring. A dashboard template is a visual tool that provides a bird’s eye view of critical metrics and data points critical to an organization’s success. Given the skyrocketing demand for data analytics, dashboard templates have become an integral part of analytical solutions. They provide robust insights into business operations, allowing users to make thoughtful choices quickly. However, that is not all to understand. Discover the full power of dashboard templates and unlock the dashboard benefits that drive business success!
Dashboard Definition: Navigating Data Insights
A dashboard is a clear and concise visual interface showing the most important data and metrics. In other words, it is a digital tool that helps interact with the most complex sets of data. The primary role of a dashboard is to present a brief overview of how an organization is performing at a particular moment. Becoming a key performance indicator and value metric, a dashboard facilitates decision-making and goal tracking. The tool is dynamic and often connected to analytic platforms. Thus, it enables users to interact with data with a more in-depth perspective to reveal trending, patterns, or room for improvement. A dashboard is a customizable element that displays precisely needed information and aligns with a business intelligence system. No matter its form or features, it includes various chart types and other visual elements, making data interpretation smoother. Dashboards serve as crucial instruments for navigating perspectives through piles of data to succeed.
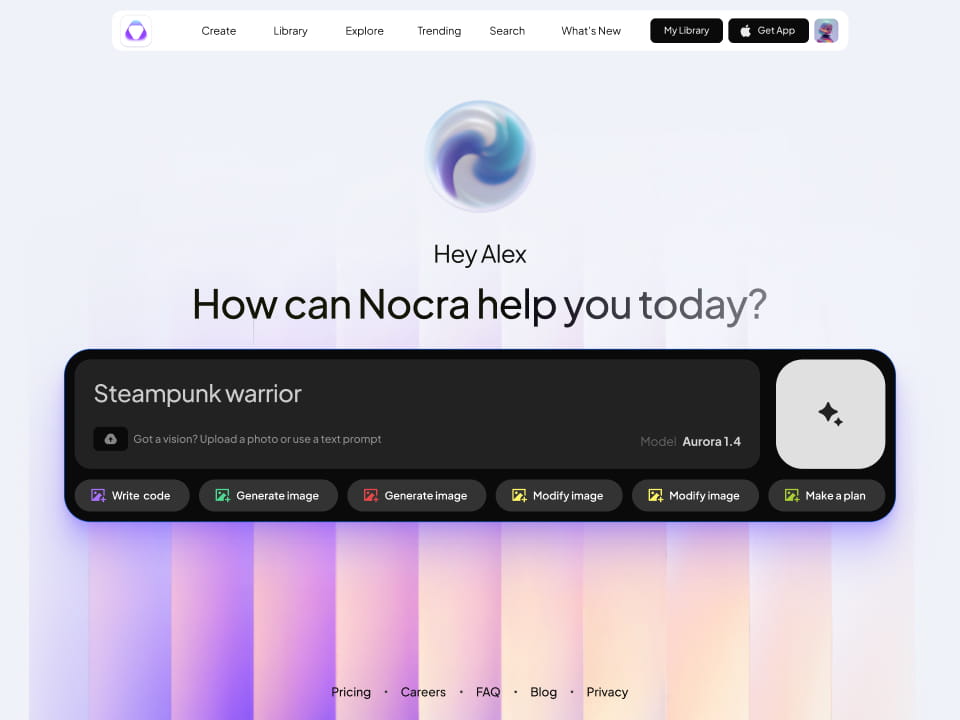
A dashboard may look like the following:

When Should You Use a Dashboard? Strategic Deployment
Dashboards are tremendously useful tools for lots of different scenarios in an organization. Here's a couple:
- Testing Hypotheses: Dashboards are a great way to test a theory. They give you a visual representation of data trends and patterns so that you can see if the numbers bear your predictions or not. Users will have reason to refine into any assumption when they see how it is actually shaking out visually on their screen. This enables anyone using dashboards–street smart or not! –to back up what they're saying with cold hard statistics and make sure their work really stands up.
- Tracking Progress: Dashboards can monitor real-time progress toward specific goals, making people empowered to act in the present and adjusting strategies as necessary to get the correct desired result.
- Finding Problems: Dashboards allow people to spot problems and anomalies early in datasets, so that steps can be taken by managers for proactive error correction before they escalate into full-blown disasters.
- KPI Monitoring: By offering a single centralized place for checking out how well major performance indicators (KPIs) are being met, dashboards keep stakeholders abreast of developments with performance metrics and help them swiftly recognize what needs improvement.
- Making Informed Decisions: With the insights offered by dashboards, decision-makers can rationally and analytically reason their ways toward strategic planning that will lead to more effective execution.
How to Choose a Dashboard: Selecting the Right Fit
At the time of selecting a dashboard for your business, it is essential to adopt a structured approach; this guarantees that it is both right for how you like it and won’t debase subsequent results. Here are some steps to be taken:
- Define Your Objectives. Start by outlining clearly what your goals are and you hope to achieve with the dashboard. Identify the most important metrics and data points needed for monitoring and deciding.
- Assess Your Data Sources. Evaluate where the data sources used in today's version of Microsoft Excel come from. Find out whether your new dashboard will interface seamlessly with them all.
- Improve User Accessibility. Study the potential end users of your dashboard and assess their ability to use a computer system. Choose for simple interfaces that provide helpful information without facing subjects too difficult.
- Customization. Look for dashboards that allow you to specify how reports and visualizations are presented.
- Scalability and Flexibility. Choose a dashboard that can adapt to rapid growth as well as changing needs over time without sacrificing performance. By following these steps, you ensure that you select a dashboard which not only matches your goals but also helps make better decisions in your organization.
Turn the dashboard upside down for the maximum in efficiency and insight
Dashboards offer a variety of benefits that opt for faster protocol, better decisions, and a sense of openness in organizations. Now, let's see what benefits of dashboard templates can bring to help you survey the landscape:
- Reduced Reporting Time: Dashboards are efficient tools for shrinking the amount of time spent on manual report creation. By winding data in from a variety of sources to one central location, dashboards streamline the entire process. Instead of investing valuable time recycling data from this or that source, you can use a data dashboard only to access your insights in full. This tight integration of data means there's no need for manual entry or reconciliation -- so we don't have to worry about mistakes slipping through either way at all stages of production. Therefore, people will be able to dedicate more of their time towards analyzing the relevant information and turning data presentations on a dashboard into more news stories. The benefits of dashboard reporting are evident in the significant time savings and enhanced data analysis capabilities it offers
- Single Source of Truth: In order to be more transparent and let everyone be on the same page, the importance of setting up a single source truth cannot be emphasized too heavily. This is where dashboards come into their own as a crucial plank in that effort, ensuring everyone who needs it has up-to-the-minute information at their fingertips. By storing important metrics and performance indicators in a single one-stop place, dashboards make sure that all stakeholders are working from the same information. Thus, decision-making and strategic planning processes gain continuity--none of this chop and change arbitrariness as seen from sources outside the dashboard, green fields gone over with new techniques or tired ones renewed way beyond their sell-by date because some wheeler-dealer told everyone it was needed. If anything, a single source of truth adds to organizational agility. Having all stakeholders using the same version of the truth permits them all to respond quickly when market directions change or new opportunities emerge from nowhere.
- Actionable Goal Setting: Interactive real-time dashboards help organizations set goals that can be acted upon and monitor their progress. Dashboards provide immediate access to performance metrics, which means a goals cycle of setting, monitoring and refinement is never interrupted. This way, organizations can adjust their goals as new insights and market conditions emerge. The result is an ongoing process of refinement that brings continuous improvement as well as speed in making changes. Apart from that, dashboards pose questions that profit-seeking workers need to address: How do we find opportunities targeting our investment or other resources? By means of a data-driven approach to goal setting, dashboards help organizations to make informed management decisions and tailor their strategic initiatives for success.
- Enhanced Accountability: Dashboards are a critical element in establishing a culture of responsibility by providing full transparency about operations. By specifically delineating individual and team responsibilities, dashboards link key performance indicators (KPIs) to employee goals. When the two sides match up, it encourages employees to actually pay attention to and take ownership over their work, with the result that this attitude of responsibility permeates throughout the whole organization.
- Improved Team Communication: Dashboards not solely offer insight into performance metrics. They also encourage better communication among employees by strengthening relationships between its people with greater awareness of company goals and progress, and team members can better understand their part in achieving them. This shared better understanding of their role in a given mission leads to a more cooperative atmosphere behind the scenes, one that helps break down barriers and encourage cross-functional coordination so that teamwork becomes a more integrated whole Performance management is streamlined, routine tasks can be handled by more suitable (or cheaper) systems, and unforeseen downtime minimized or eliminated
- Automation of Tedious Tasks: One of the largest advantages a dashboard can bring is its ability to automate tasks that are repetitive anyway, which saves time in the long run. Through such functions as automatic report generation and data analysis, dashboards streamline work processes and cut down on human errors. By making such routines mundane activities rather than something upon which workers need to pour all their efforts, productivity may rise as a consequence for all those involved in the organization.
- Reduced Human Error: Dashboards even have automation and centralized data storage, so that the risk of human error in data analysis and reporting is minimized. This avoids manual rework and centralization of data ensures the legitimacy and completeness of data, and thereby deepens the reliability of intrinsic meaning.
- Faster Data Processing: With intuitive visualization dashboard tools and a method for central data access, Dashboards make it easy to analyze business data quickly, which means that decisions can be speeded up and actionable insight gotten out faster. The faster you can organize information and build opinions on that basis, the more money you will make.
- At a Glance Visualization: Key performance indicators and figures are possible to be directly accessed instantly with dashboards from real time data. In breaking down complex information for easier digestion by humans, dashboards also eliminate bottlenecks. That's one of the ways through which organizations convert data into action.
For an efficient and customizable solution, consider using the Material X Design System for Figma, which provides a comprehensive Figma library with over 1100 components and 40 app templates, designed to streamline the process of creating effective dashboards.

- Cost and Time Savings: By streamlining reporting processes, reducing manual effort, and They save organizations significant amounts of cost and time. As a result, the efficiency gains bearing upon dashboard use translate into palpable business benefits and increased ROI.
- Enable Data-Driven Decisions: Dashboards provide real-time insights into key metrics captures and helps identify trends, so companies can make informed decisions based on their data. By presenting information in visually engaging formats that resonate with audiences (and are far sighted enough to see), dashboards make it possible for busy people–like say, high-level government officials–to quickly understand complex information and come up with some ideas of what they should do next.
- Support Strategic Planning: with access to complete performance information, organizations can prepare better strategic plans and strategies. Through the effect provided by dashboards organizations monitor progress toward their strategic objectives, discover emerging opportunities, and adapt tactics to a changing market environment.
- To Increase Customer Satisfaction: A dashboard can be used for monitoring key performance indicators in relation to customer satisfaction and engagement. This means that organizations often preempt problems and improve the overall customer experience. Dashboards help stakeholders find out what customers are saying, where they get sore points and which changes might be geared to increase customer retention. Unlock the benefits of using dashboards to enhance your customer satisfaction strategies and gain valuable insights into optimizing your business processes.
- A Culture That Respects Data: Dashboards promote a data-driven culture in organizations They make everyone accountable and transparent. When all stakeholders have access to real-time performance data, the dashboard empowers everyone in making informed decisions at all levels of the organization toward alignment with visions for shared goals and objectives.
- Competing Effortlessly: Organizations are able to breast the tape in their industry by using dashboards to get a read on market trends, demand for your services and product, also what competitors are up to. Dashboards help stakeholders find unique selling points, optimize their marketing strategies or tailor products and services based on data-driven insights.

In short, dashboard templates provide a full solution to organizations who want to improve on data management, streamline reporting processes and obtain analyses that can be turned into feedforward information or new strategies. By leveraging the myriad benefits of dashboards, organizations can enhance operational efficiency, promote transparency and effectively accomplish strategic objectives.
Conclusion:
In this way, dashboards have opened wide-ranging vistas for the organization in terms of data-driven (formerly resigned to human intelligence) work. Without reducing time consuming reports and an aspiration to make money pour down in cash buckets like water from a watering can, with this board you can get stakeholders themselves involved over whether to seek growth or still go for bonuses at year's end. Benefits of using a dashboard extend far beyond mere data visualization, empowering stakeholders to actively engage in strategic decision-making processes and align organizational goals for sustainable growth.
.avif)
.avif)

.avif)
.avif)


.avif)
.avif)


.jpg)

.avif)
.avif)
.avif)


.avif)


%20(1).avif)

%20(1).avif)
.avif)
.avif)


